


DATA ANALYTICS: Benefits of a Modern Dashboard for Manufacturing Plants
In today’s manufacturing world, data and analytics are becoming increasingly important in the decision making processes. Since the goal of any manufacturing plant is to produce the correct amount of product, as safely and efficiently as possible, Manufacturers need to constantly look for ways to continually improve. A modern dashboard is one such way to take raw production line data and present it in a way that it becomes useful information for various system stakeholders such as plant management, operations, and maintenance. This blog will go over some of the many benefits of a well-designed plant dashboard.
Design with end users in mind
Before discussing the benefits of a dashboard, the first steps are defining purpose, users, and content of the dashboard. Different plant personnel care about different Key Performance Indicators (KPI) and need different data revolving around the manufacturing process. For example, the plant manager is looking for a high-level overview of what is occurring across the plant. In comparison, a maintenance technician is looking for more detailed & data-driven equipment information. Therefore, the starting point in any well-designed dashboard is to interview the individuals who will be using it regularly to determine what information is most useful to them. Once the user groups and content are established the development process can get underway.
When designing a dashboard there are a few key principles that should be incorporated. Organization of information, easy to understand, simple to access are three concepts that make a successful dashboard. The content should be organized in such a way that it is easy for the user to locate the information they are looking for. At a manufacturing plant this might mean that each production line has its own screen or section with data relevant to that line. Once the user locates the data the way the data is presented should be able to be quickly understood and interpreted. This means the utilizing the proper visuals such as charts, graphs and tables that will help the user absorb the information presented.
Reduction of Manual Tasks
One of the key benefits of a plant dashboard is reducing data collection and reporting that needs to be done manually. Once a dashboard is designed and deployed, KPIs and other information are available at your fingertips. The hassle of manually extracting raw data from a system, manipulating it in excel, and creating charts for that data is a thing of the past. The dashboard will collect and transform all the necessary data for you. In the past, this type of manual data collection frequently occurred on a regular basis such as weekly, monthly, quarterly, and yearly. Not only can a dashboard automate the manual process described above, but a well-designed dashboard can be filtered for different time periods, eliminating the need for recurring manual data collection.
Provide information instantly
Now more than ever, information is available instantaneously. This not only applies to how we use our personal devices like cell phones and laptops, but to professional manufacturing situations as well. A plant dashboard is a perfect example of instant data. All the user needs to do is pull up the dashboard and the information they need can be retrieved quickly. Whether the user is looking for line performance information, inventories, or quality data it can all be pulled in a relatively quick timeframe.
Actionable Information
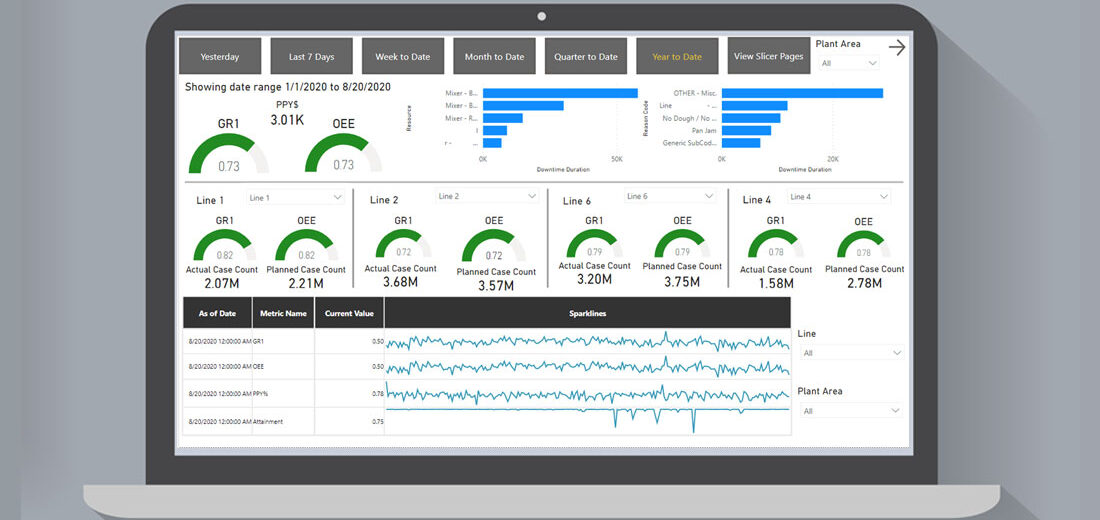
The most important aspect of a dashboard is that this instantaneous information helps identify areas of improvement that need to be made to the manufacturing process. With a little bit of process knowledge the KPIs and charts displayed on the dashboard can help identify which areas in the plant could be more efficient. A standard KPI used across the manufacturing industry is Overall Equipment Effectiveness, more commonly referred to as OEE. This KPI takes into account how well the production line is doing versus the planned activities for the line. Having a KPI like OEE on a dashboard is a good way to help plant management identify which lines/SKUs are producing adequately and which need improvement. Not to mention, even further investigation can be done to identify which part of the process is the bottleneck, but the OEE KPI on a dashboard is often the first step towards improvement.
Another example of dashboard information that helps identify areas for improvement is quality data. Having quality data as part of a dashboard can quickly show you when a quality issue is occurring. Whether in real-time or not, the quality data collected indicates any issues with the goods being produced. When management sees skewed quality metrics they quickly deduce something is not quite right and needs to be addressed. A quality issue does not necessarily need to be a defect of the product itself. It may be something as simple as the weight of the product. Taking periodic samples from the production line can help ensure that the end customer is receiving the amount of product they are paying for. This type of quality data can also be tracked and trended on a dashboard to visually identify when certain quality specification are going out of the defined spec.
Having a historical aggregation of alarms can also be the starting point for addressing reoccurring issues that are hindering production capabilities. A dashboard can help provide insight into how many times, or how often, a certain problem comes up. If a certain alarm is sounding off frequently, resulting in downtime on the production line, then having this type of information on a dashboard would quickly highlight what needs to be fixed. A dashboard that has an occurrence count for each alarm helps identify which issues are most problematic so plant personnel can focus there first.
Conclusion
While it’s not a necessity, a well-designed dashboard is a tool manufacturing plants can use to help understand the inner-workings of plant operations. The dashboard should display information that will be most useful to plant personnel so that actions can be taken to help increase production efficiency.
Image Source: macrovector